earthquake
CNN - February 2011
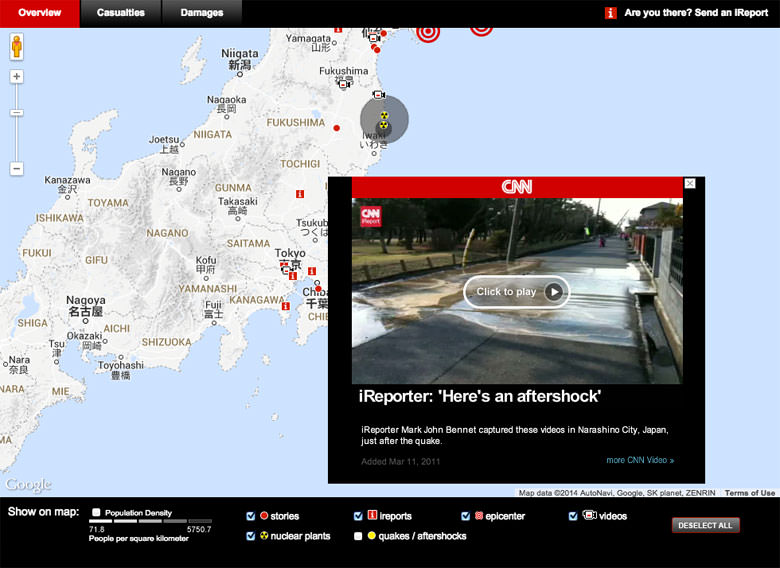
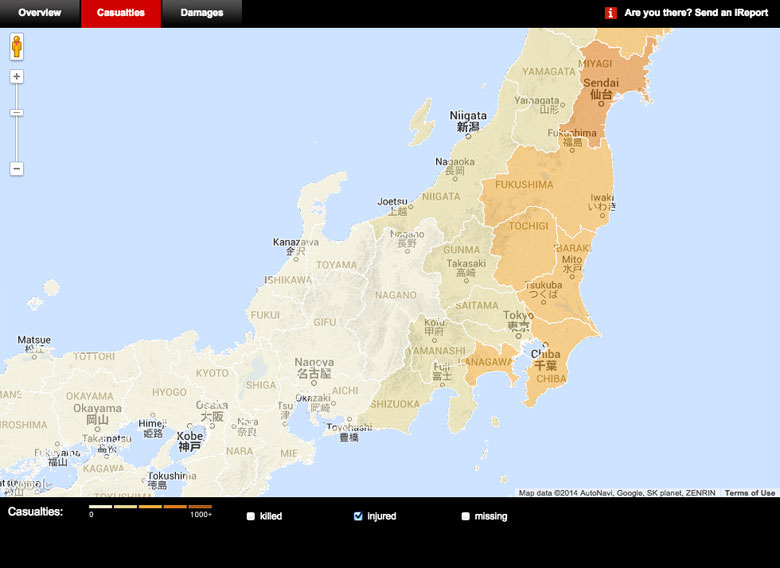
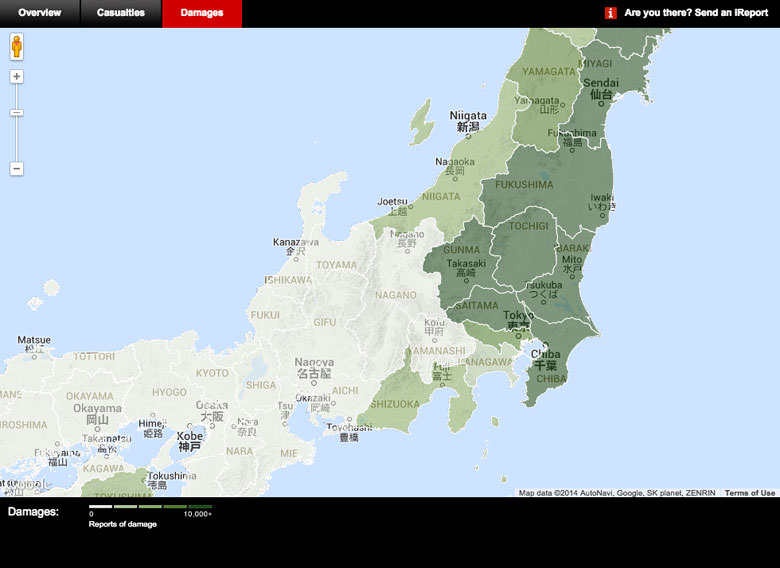
Plotting user submitted videos, along with updates from CNN.com on an interactive map. We gathered data from the red cross and government agencies on casualties, and damage - displaying them as heat maps.


Plotting user submitted videos, along with updates from CNN.com on an interactive map. We gathered data from the red cross and government agencies on casualties, and damage - displaying them as heat maps.


